Corporate Product Impacts on Ecosystems: Risks and Opportunities

Product-level impact analysis highlights where corporate portfolios create biodiversity risk and where targeted innovation offers pathways to support life on land and life below water.
Earth Day, observed annually on April 22, provides an opportunity to reflect on how corporate activity shapes outcomes for the planet’s terrestrial and marine ecosystems. Beyond operational footprints, companies exert some of their most direct environmental influence through the products and services they bring to market. As consumption patterns evolve and sustainability considerations increasingly inform business and investment decisions, scrutiny of product-level impacts on biodiversity, ecosystems, and natural capital continues to intensify.
Consumer expectations are shifting toward solutions that minimize harm to life on land and life below water, while investors are incorporating impact considerations into portfolio construction, stewardship, and risk assessment practices. At the same time, regulatory developments are expanding the scope and clarity of impact-related disclosures. Frameworks such as the EU Taxonomy, alongside similar classification and reporting initiatives adopted or under development in jurisdictions including Chile, Mexico, China, Korea, the United Kingdom, Indonesia, Canada, Brazil, Japan, and South Africa, seek to distinguish economic activities that contribute positively to environmental objectives from those that may cause harm. Many of these initiatives directly or indirectly address impacts on terrestrial and marine ecosystems, reinforcing expectations for more transparent disclosures on how products and services interact with natural systems.
Sector-Level Exposure to Ecosystem Impacts
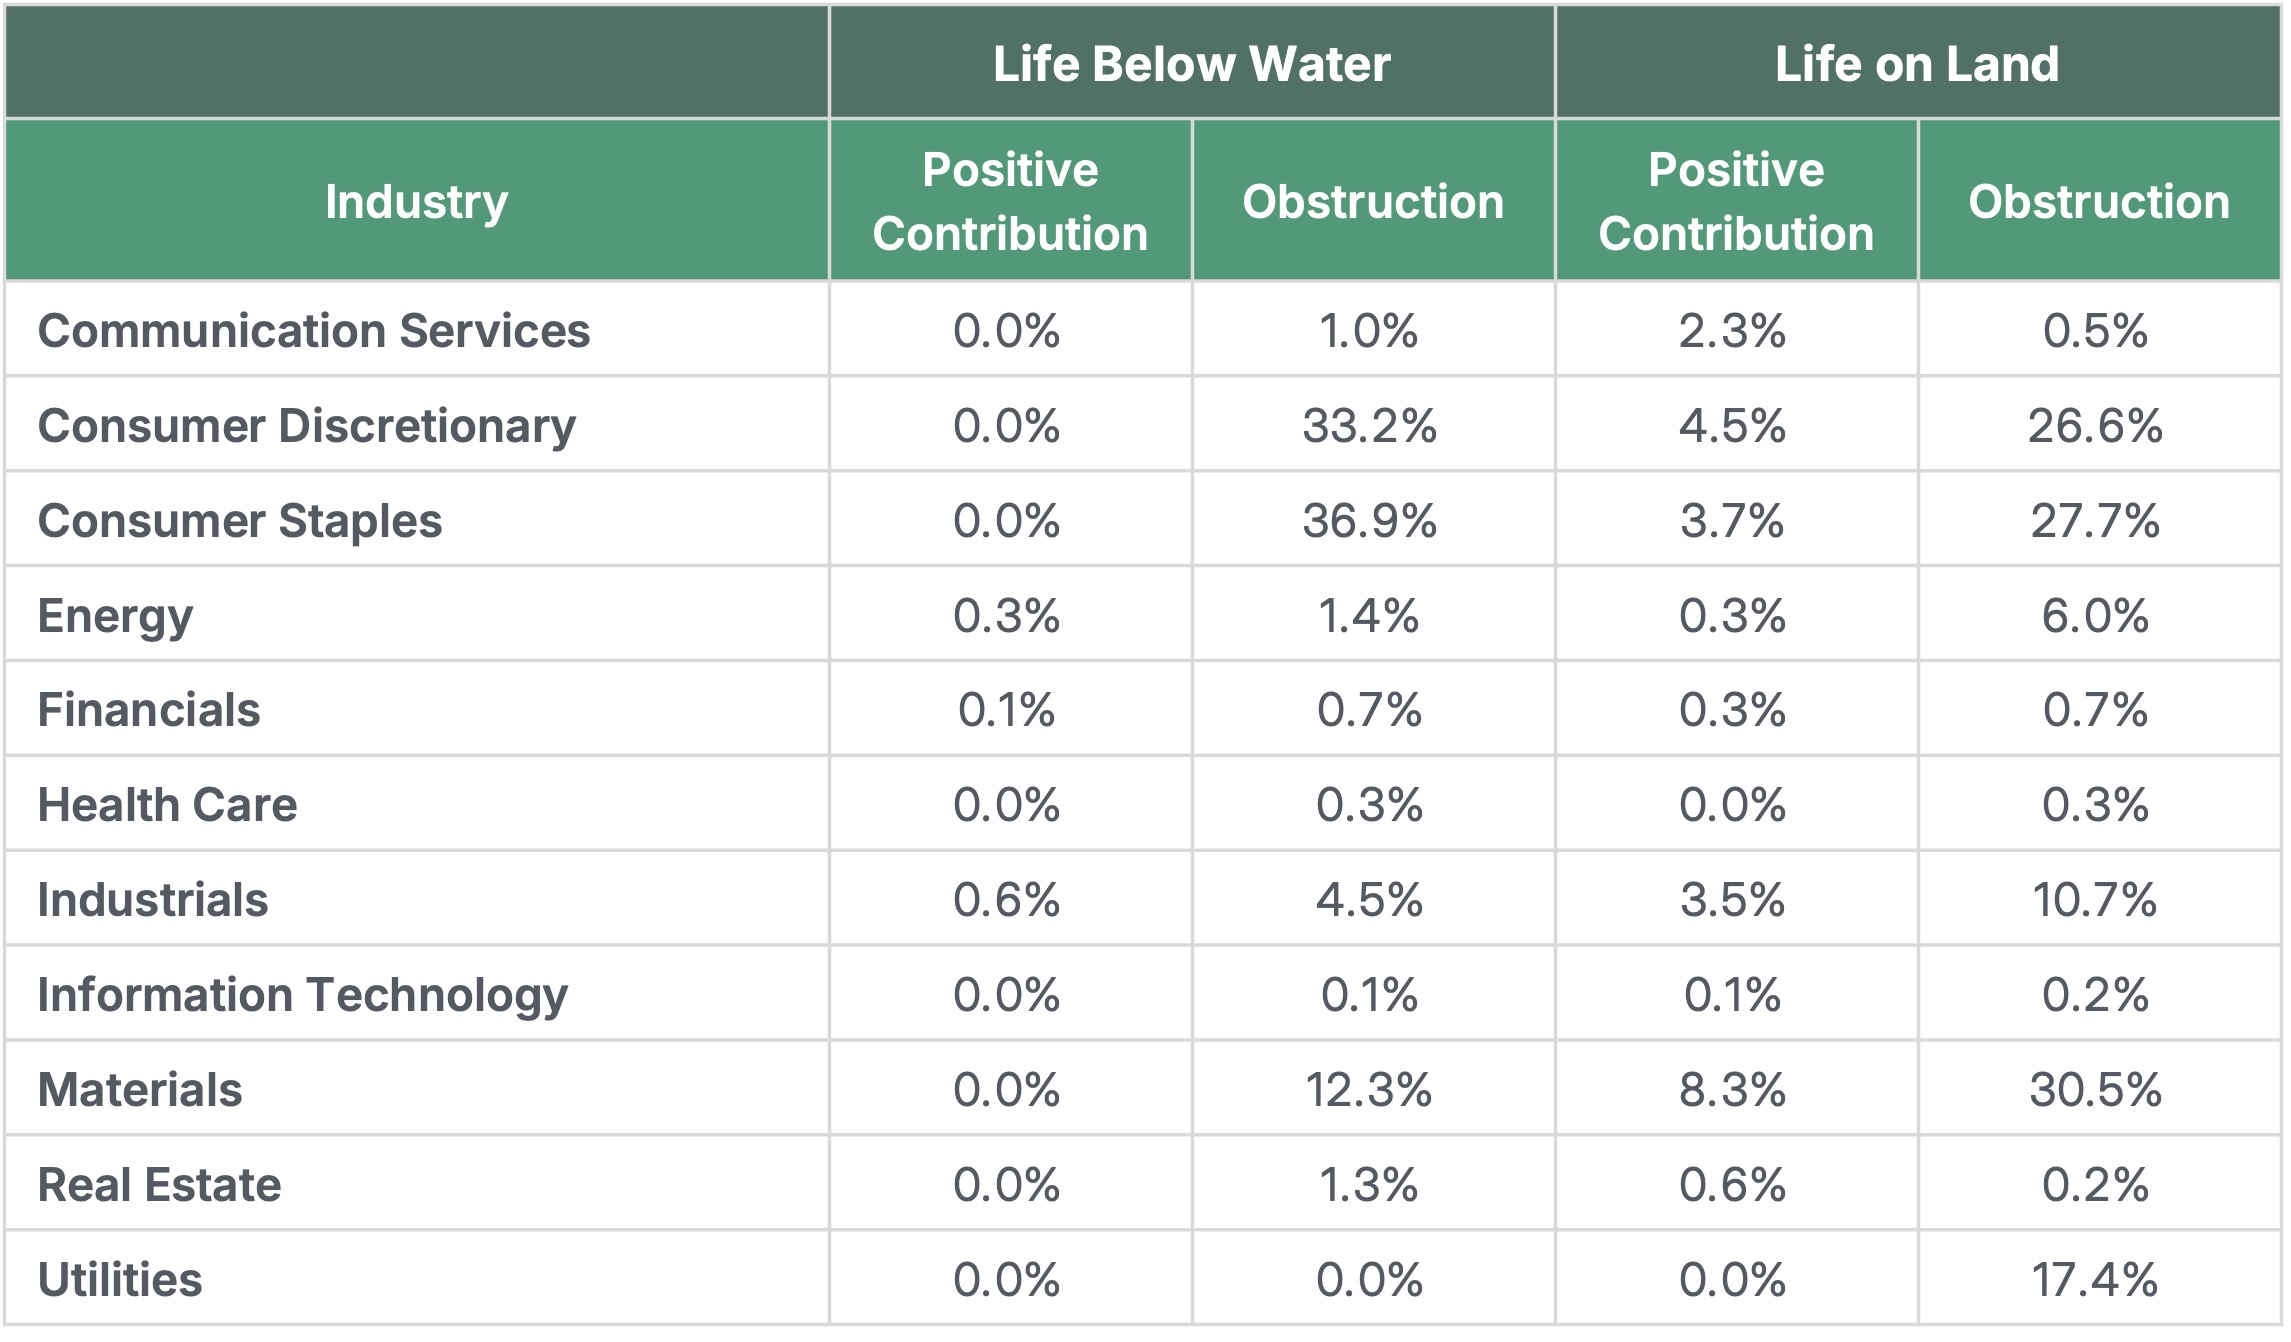
ISS-Corporate analyzed product and service impact data for 8,207 companies globally to identify patterns related to Life Below Water (SDG 14) and Life on Land (SDG 15). The analysis highlights pronounced differentiation across sectors. Overall, relatively few companies generate revenues from products or services with clearly positive impacts on terrestrial or marine ecosystems, while exposure to activities associated with negative impacts is more widespread.
Negative impacts are particularly prevalent in Consumer Discretionary, Consumer Staples, and Materials, where a substantial share of companies are associated with products linked to ecosystem degradation on land or in marine environments. By contrast, sectors such as Information Technology, Health Care, and Financials show limited direct exposure – both positive and negative – reflecting more indirect relationships with biodiversity outcomes.
Life Below Water (SDG 14): Risks Concentrated, Solutions Specialized
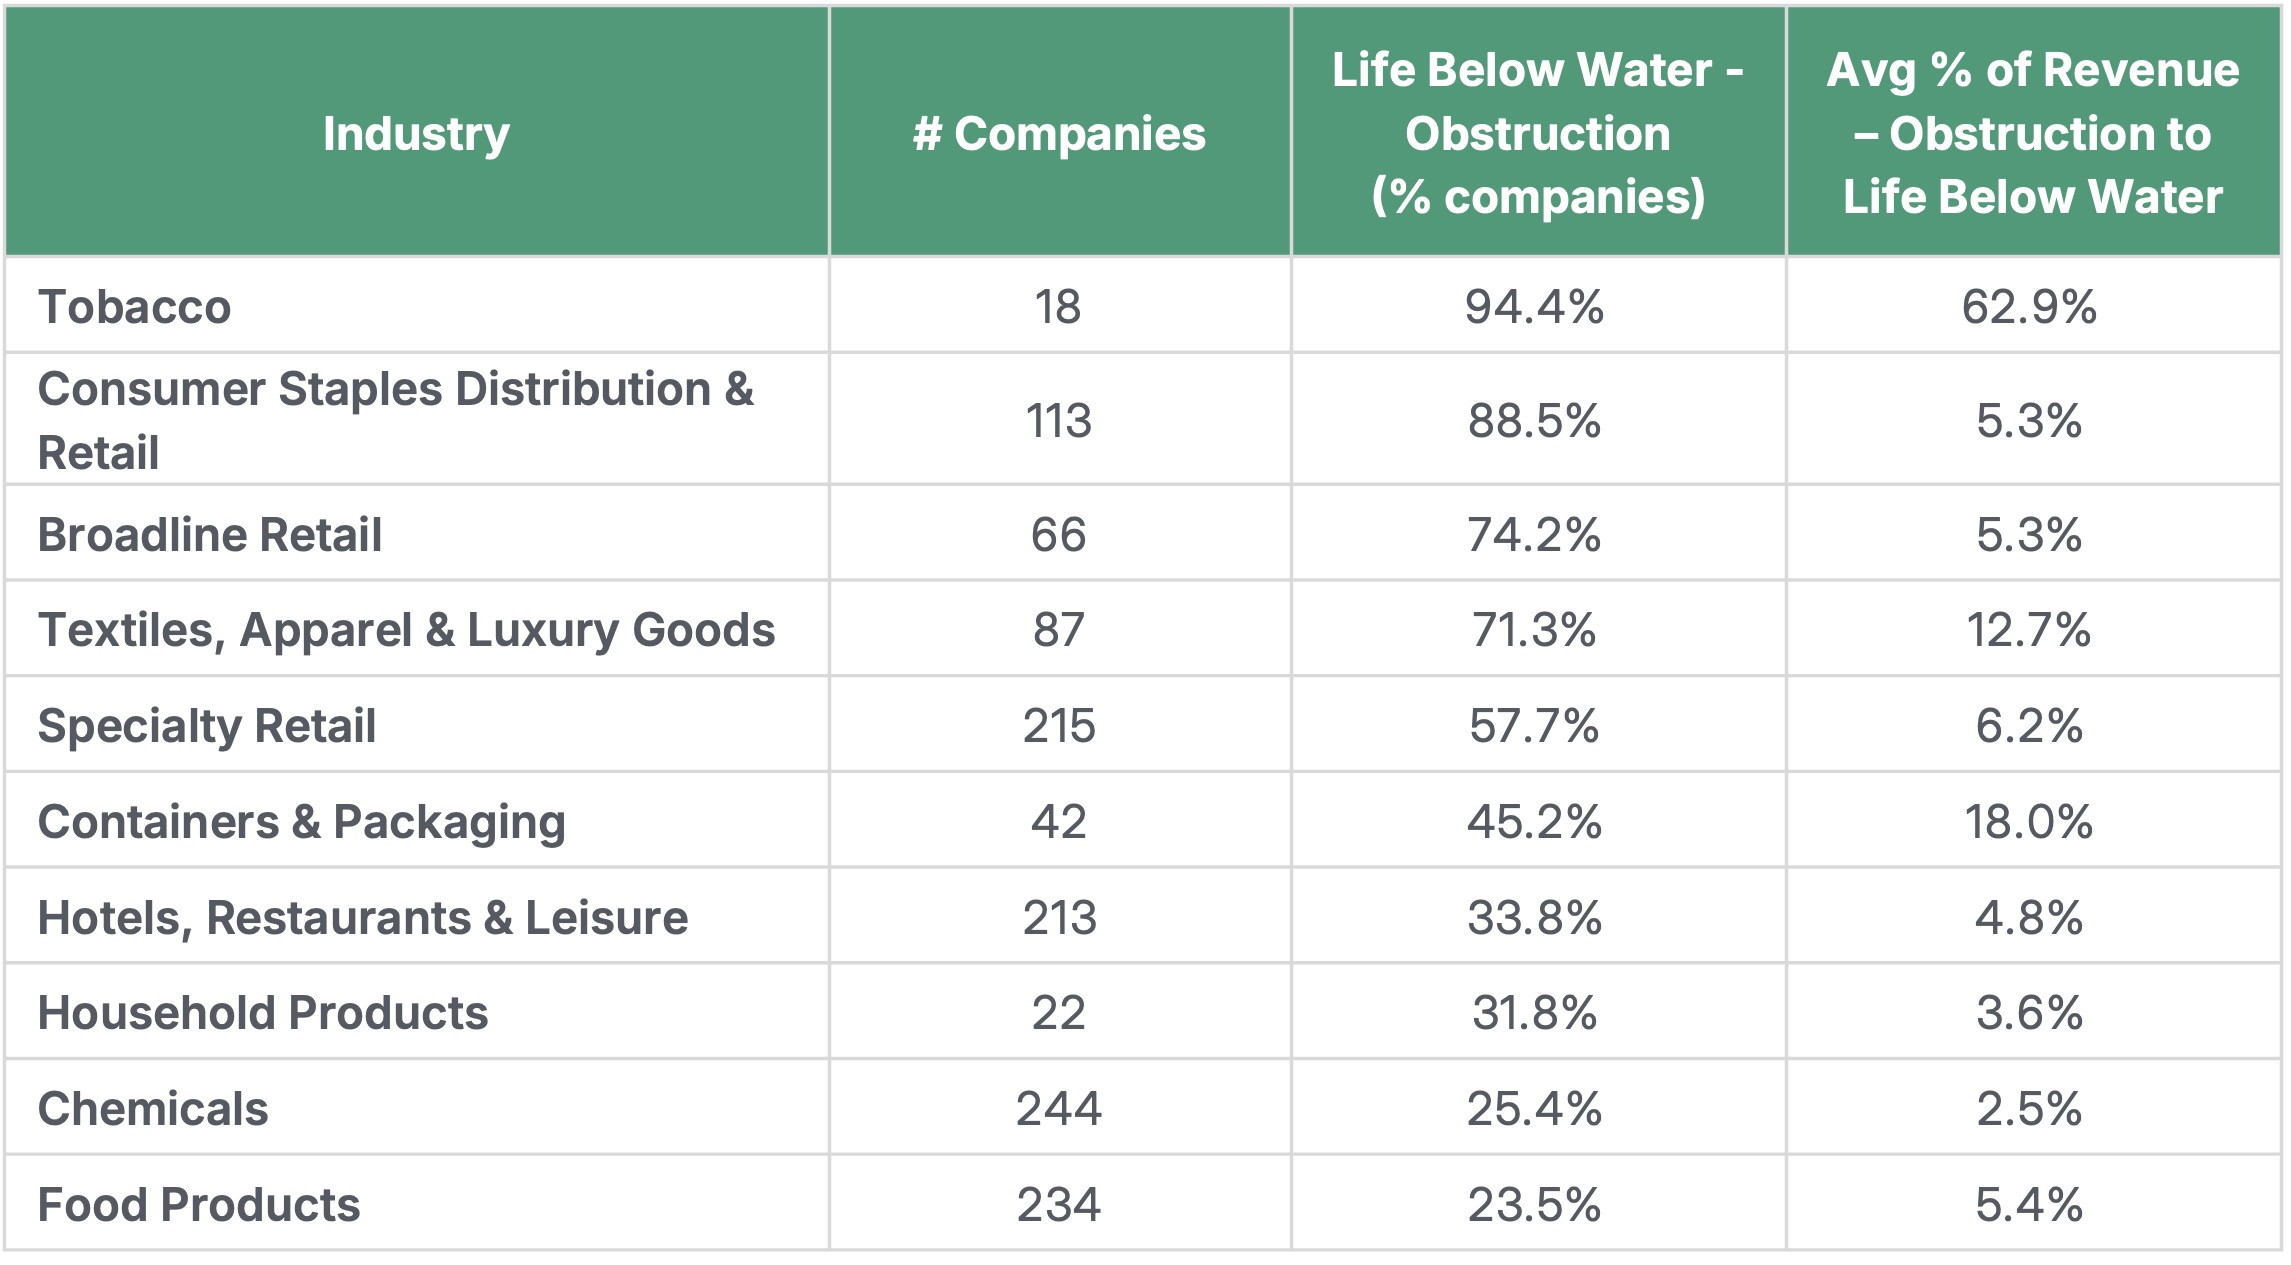
Across the industries with the highest exposure to marine-life obstruction, the data suggests that product-linked risks are concentrated in consumer-facing value chains and materials-intensive business models. Tobacco stands out, with 94% of companies in the industry associated with obstructive product impacts and an average 63% of revenue linked to those products – driven by categories such as electronic cigarettes and filtered nicotine products, as well as filter components that can contribute to persistent waste. Consumer Staples Distribution & Retail (89% of companies) and Broadline Retail (74%) also show high prevalence, reflecting product mixes that include fish and seafood offerings without relevant certification, single-use plastic products, and products containing microplastics. These patterns reinforce that SDG 14 exposure is often embedded in everyday products and sourcing choices rather than limited to a narrow set of “marine” industries.
A second set of industries highlights how packaging and synthetic materials can amplify marine ecosystem pressures. Containers & Packaging shows elevated exposure (45% of companies) with a comparatively higher average revenue share (18%) tied to single-use plastics and related components. Textiles, Apparel & Luxury Goods (71% of companies; 13% average revenue exposure) and Chemicals (25%) point to the role of synthetic polymer fibers and microplastics-related inputs. These categories are commonly associated with marine litter and microplastic pathways, where small particles can enter waterways through product use, wear, and disposal. The Hotels, Restaurants & Leisure industry (34%) contributes a different risk profile, with exposure linked to cruises (including conventional and natural gas propulsion) alongside food offerings and retail-linked product categories – underscoring that marine impacts can arise from both what companies sell and how certain services are delivered.
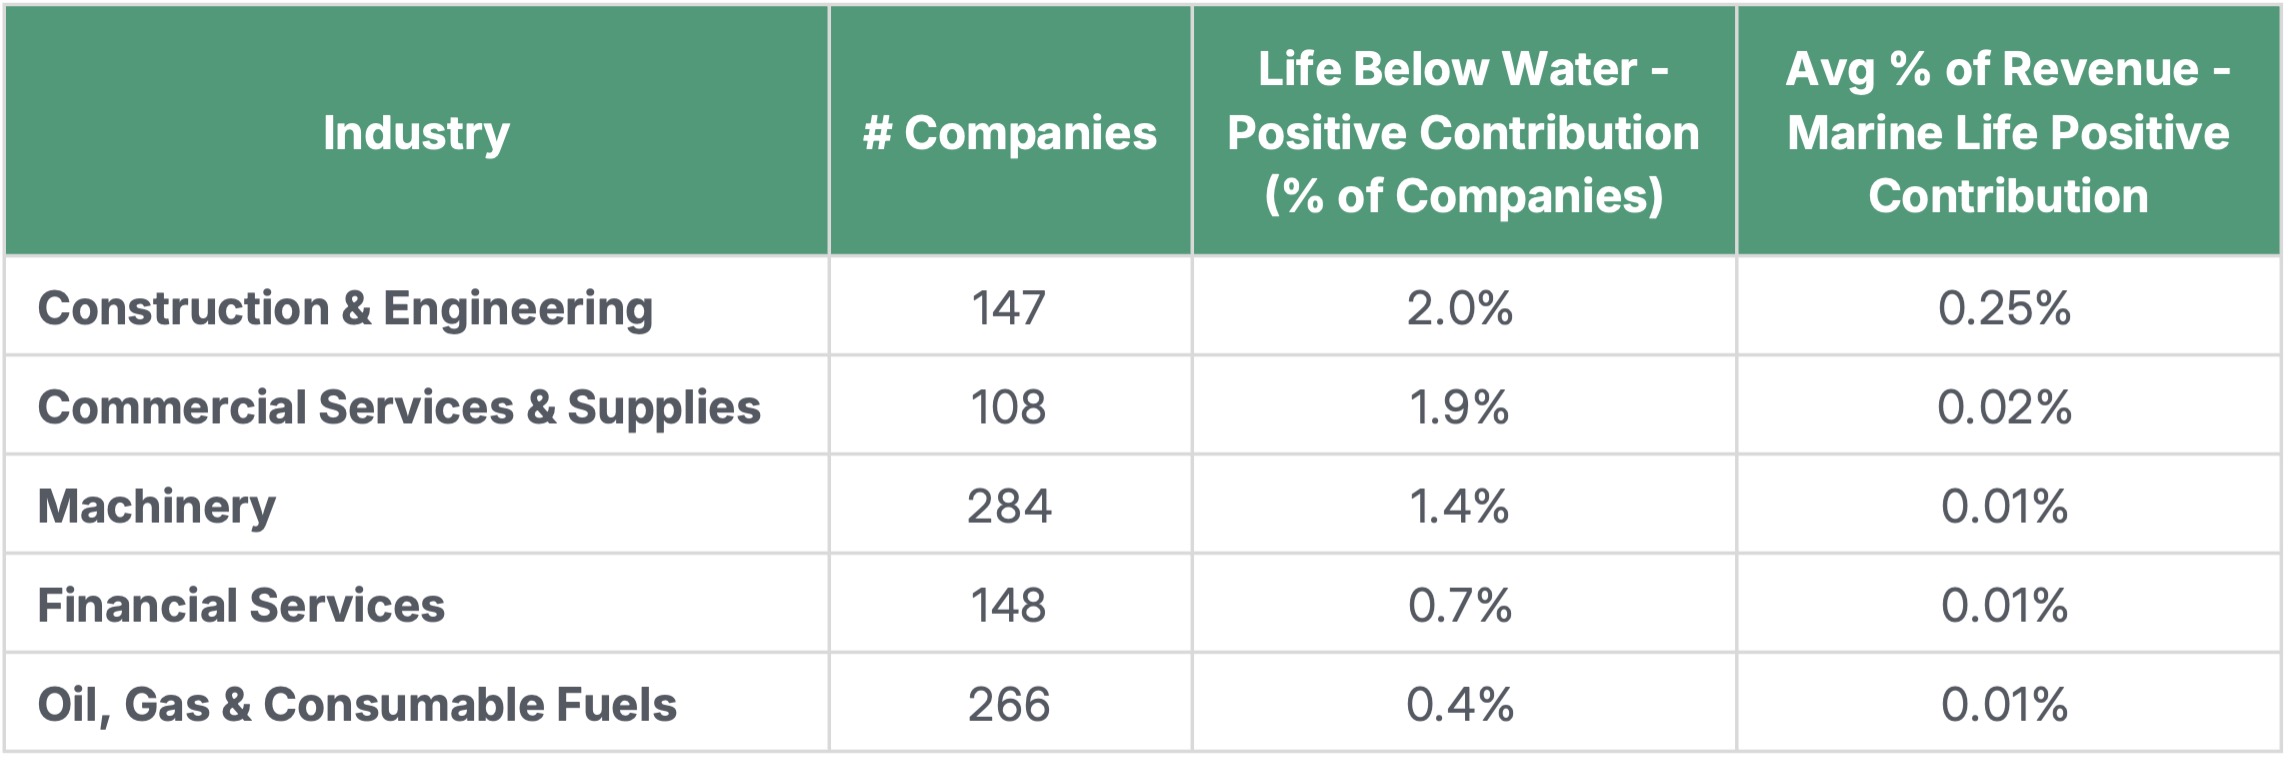
Positive contribution exposure is comparatively limited, but the data surfaces a small set of enabling products and services. Construction & Engineering (2% of companies) and Commercial Services & Supplies (1.9%) include offerings such as marine ecosystem restoration and conservation and marine oil-spill containment services. Machinery (1.4%) features ballast water management systems, which can support efforts to reduce ecological disruption associated with shipping. The Financial Services (0.7%) industry appears through financing that supports marine ecosystem restoration. Taken together, these categories suggest that SDG 14 “solutions” are more likely to sit in specialized capabilities – restoration, prevention, and mitigation – rather than in broad-based consumer product lines, reinforcing the importance of targeted innovation and capital allocation.
Life on Land (SDG 15): Product-linked Pressures and Solution Signals
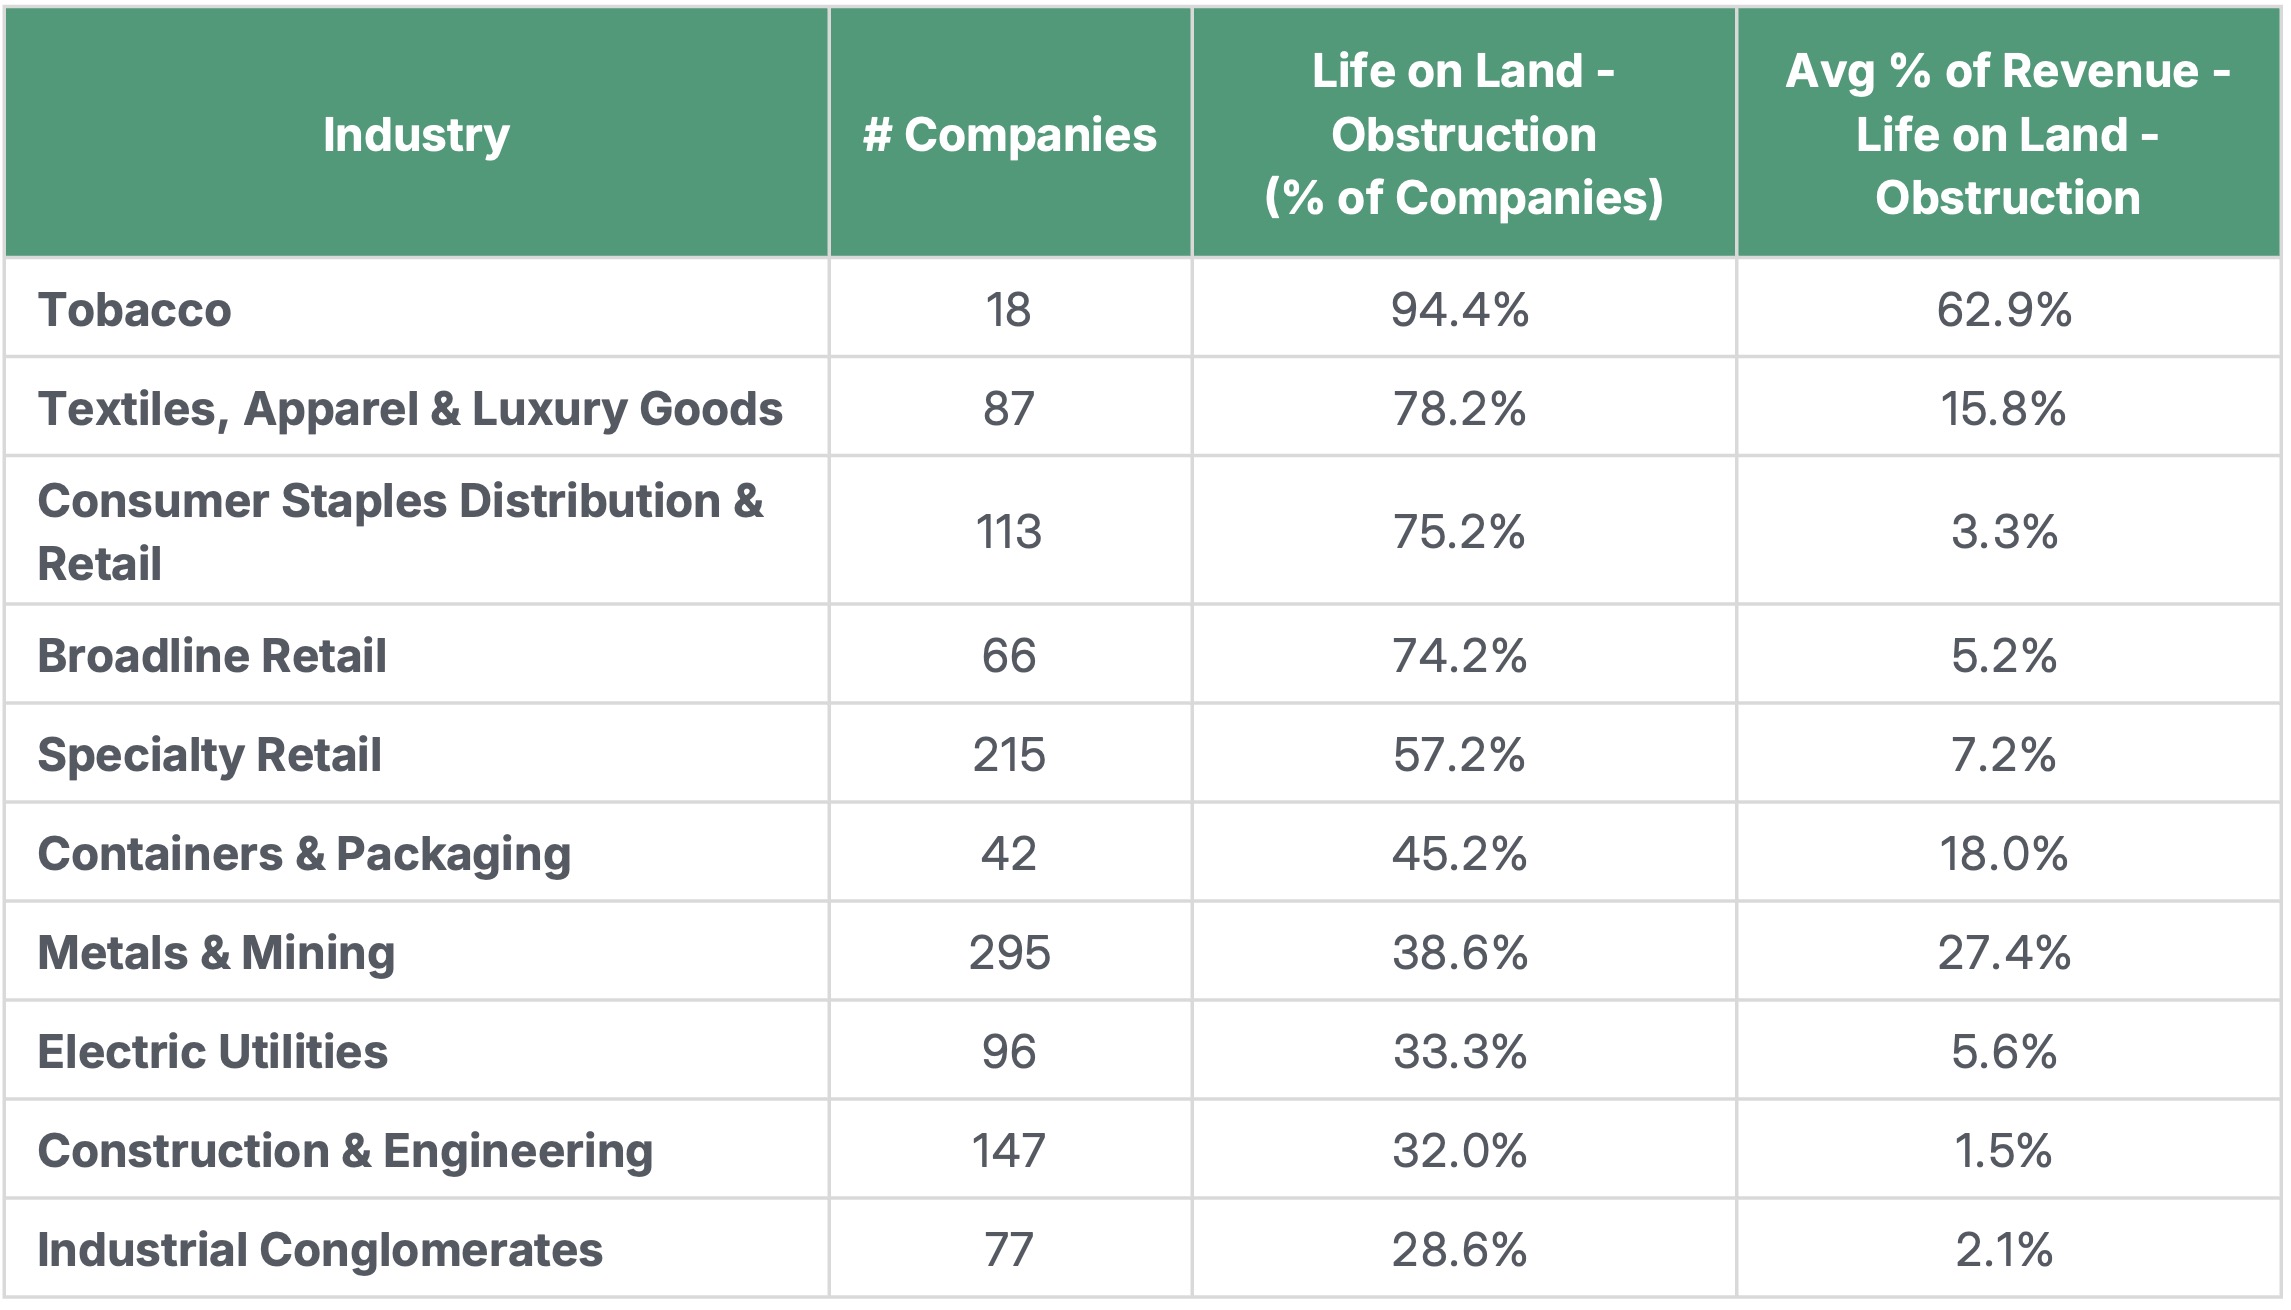
Across industries with the highest exposure to Life on Land obstruction, the product mapping suggests that negative impacts are more prevalent than positive contributions and here too sit in consumer-facing categories with complex supply chains. Tobacco again stands out (94% of companies; 63% average revenue exposure), driven by product categories such as electronic cigarettes and filtered nicotine products. Several retail-linked industries also show elevated prevalence – Textiles, Apparel & Luxury Goods (78%), Consumer Staples Distribution & Retail (75%), Broadline Retail (74%), and Specialty Retail (57%) – reflecting product mixes that include synthetic polymer-fiber textiles, products containing microplastics, and single-use plastic products, along with select extractives-linked goods such as primary gold and natural diamond-based products. The overlap with SDG 14 is notable across many of these same industries, reinforcing that product portfolios associated with plastic leakage and microplastic pathways raise both terrestrial and marine ecosystem concerns.
A second set of industries highlights land-use and habitat pressure signals tied to extractives and large-scale infrastructure. Metals & Mining shows high exposure (39% of companies) with a comparatively large average revenue share (27%), spanning gold, diamond, and uranium mining as well as related services, royalties, and streams; the mapped product set also includes extractive activities involving tailings disposal into terrestrial ecosystems. Electric Utilities (33%) and Construction & Engineering (32%) surface through products and services linked to hydropower and nuclear power infrastructure, alongside terrestrial dredging services and palm oil without relevant certification. Hydropower illustrates how classification outcomes can vary between enabling and obstructive impacts based on project design and context. In several cases, the mapping indicates that a single industry can include both enabling activities and obstructive activities, depending on the underlying product mix and eligibility criteria used in the classification.
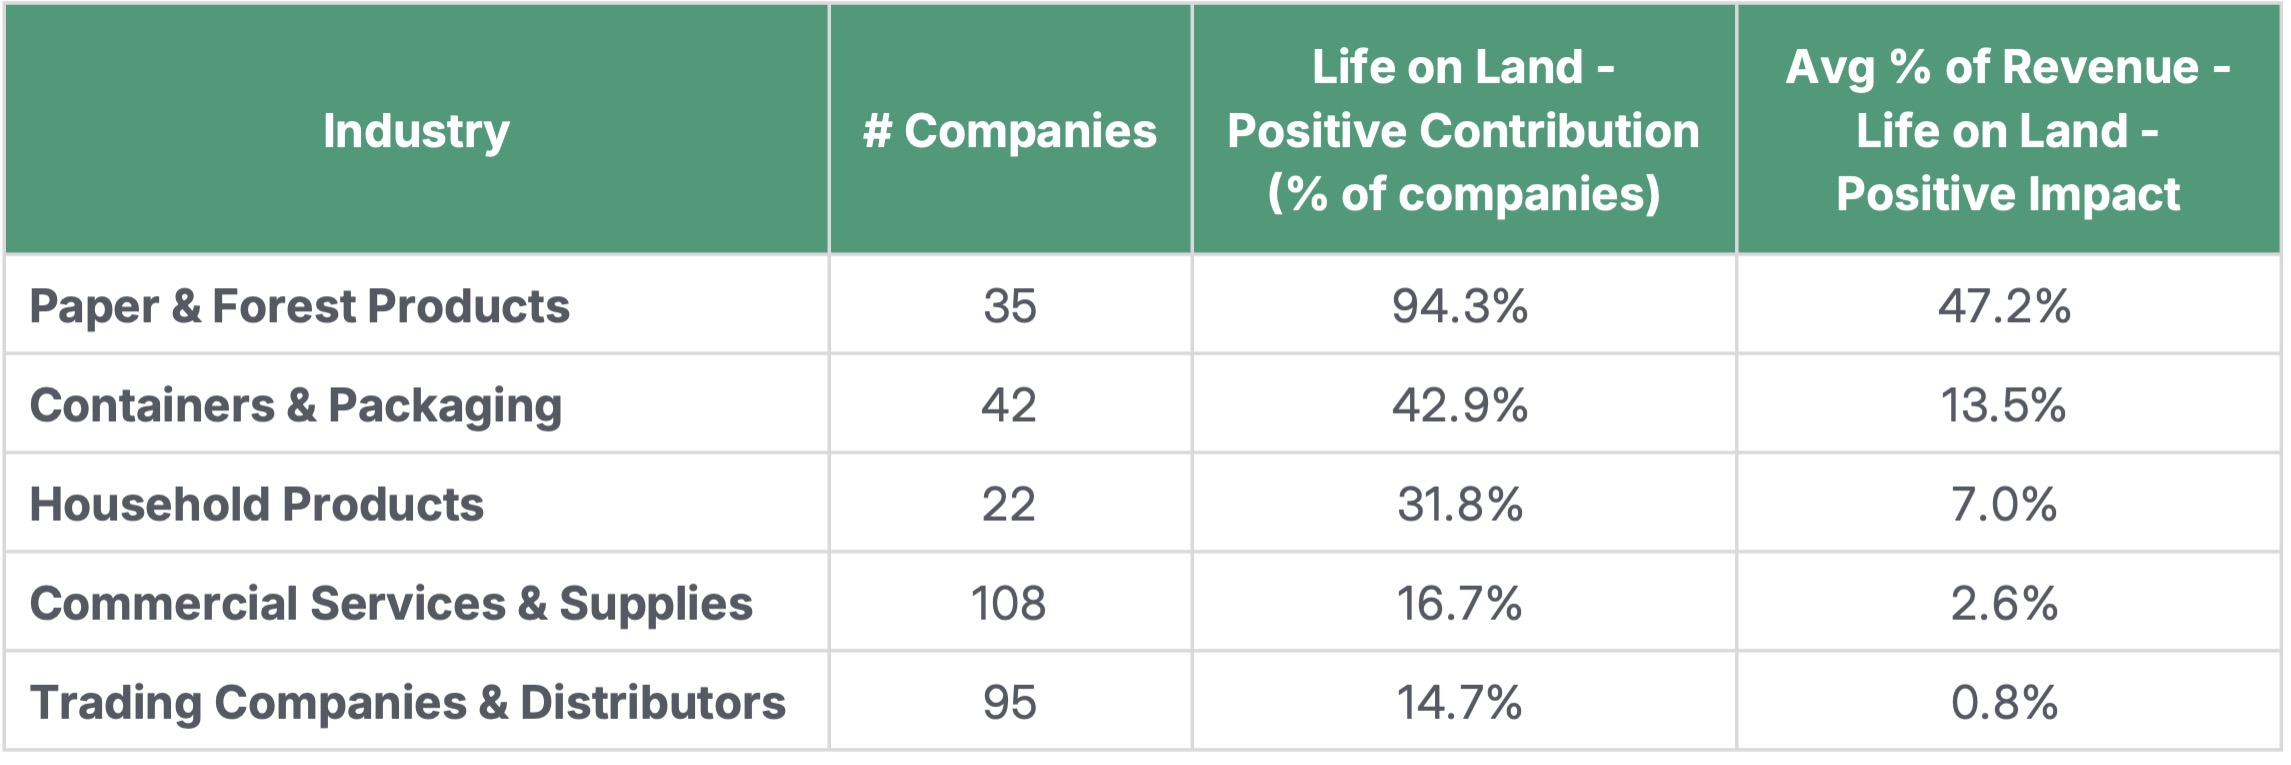
Positive contribution signals for Life on Land are more concentrated and, in a few industries, more material. The Paper & Forest Products industry shows the strongest solution profile (94% of companies; 47% average revenue exposure), centered on products from relevant certified sustainable forestry. Containers & Packaging (43% of companies; 14%) and Household Products (32%; 7%) also register meaningful positive contribution shares through certified forestry inputs, even as those same value chains can appear on the obstruction side when associated with single-use plastics – illustrating how impact signals diverge based on material inputs and use. Commercial Services & Supplies adds a distinct solutions set (17%; 3%) including soil remediation services, terrestrial ecosystem restoration, and terrestrial oil-spill containment services, highlighting that SDG 15 “solutions” often sit in specialized restoration and mitigation capabilities rather than mainstream consumer product categories.
From Product Exposure to Biodiversity Strategy
The product-level patterns across Life Below Water and Life on Land show that ecosystem impacts are embedded in core product portfolios in ways that are measurable, comparable, and subject to management decisions. Rather than representing diffuse externalities, these impacts often concentrate in specific product categories, materials, or sourcing practices – creating identifiable business risks that companies can benchmark, monitor, and address through product design, material selection, and sourcing standards. In this context, nature-related risk increasingly reflects choices within a company’s control, with clear implications for regulatory exposure, investor scrutiny, and long-term portfolio resilience.
Risk mitigation often involves targeted adjustments rather than wholesale portfolio shifts – such as substituting materials, strengthening sourcing standards, adopting certification schemes, or redesigning products to reduce pollution and habitat pressure. At the same time, the data highlights that solution-oriented activities already generate meaningful revenue in select sectors, including certified forestry products, ecosystem restoration services, and pollution prevention technologies. For many companies, these represent adjacent opportunity spaces where existing capabilities can be redeployed, enabling differentiation and participation in emerging nature-positive markets.