What the EU Taxonomy Is Revealing About Corporate Transition Readiness

Drawing on market data from nearly 1,700 European issuers and practitioner insight from the field, this article examines how the EU Taxonomy is evolving from a compliance exercise into a more strategic tool for capital allocation, investor communication, and transition planning.
Since entering into force in 2020, the EU Taxonomy has become a core pillar of the EU’s sustainable finance framework. As a classification system for environmentally sustainable activities, it creates a common language for companies, investors, and policymakers. By defining substantial contribution criteria, do no significant harm (DNSH) requirements, and minimum safeguards, it provides a structured way for companies to demonstrate alignment with climate and environmental goals.
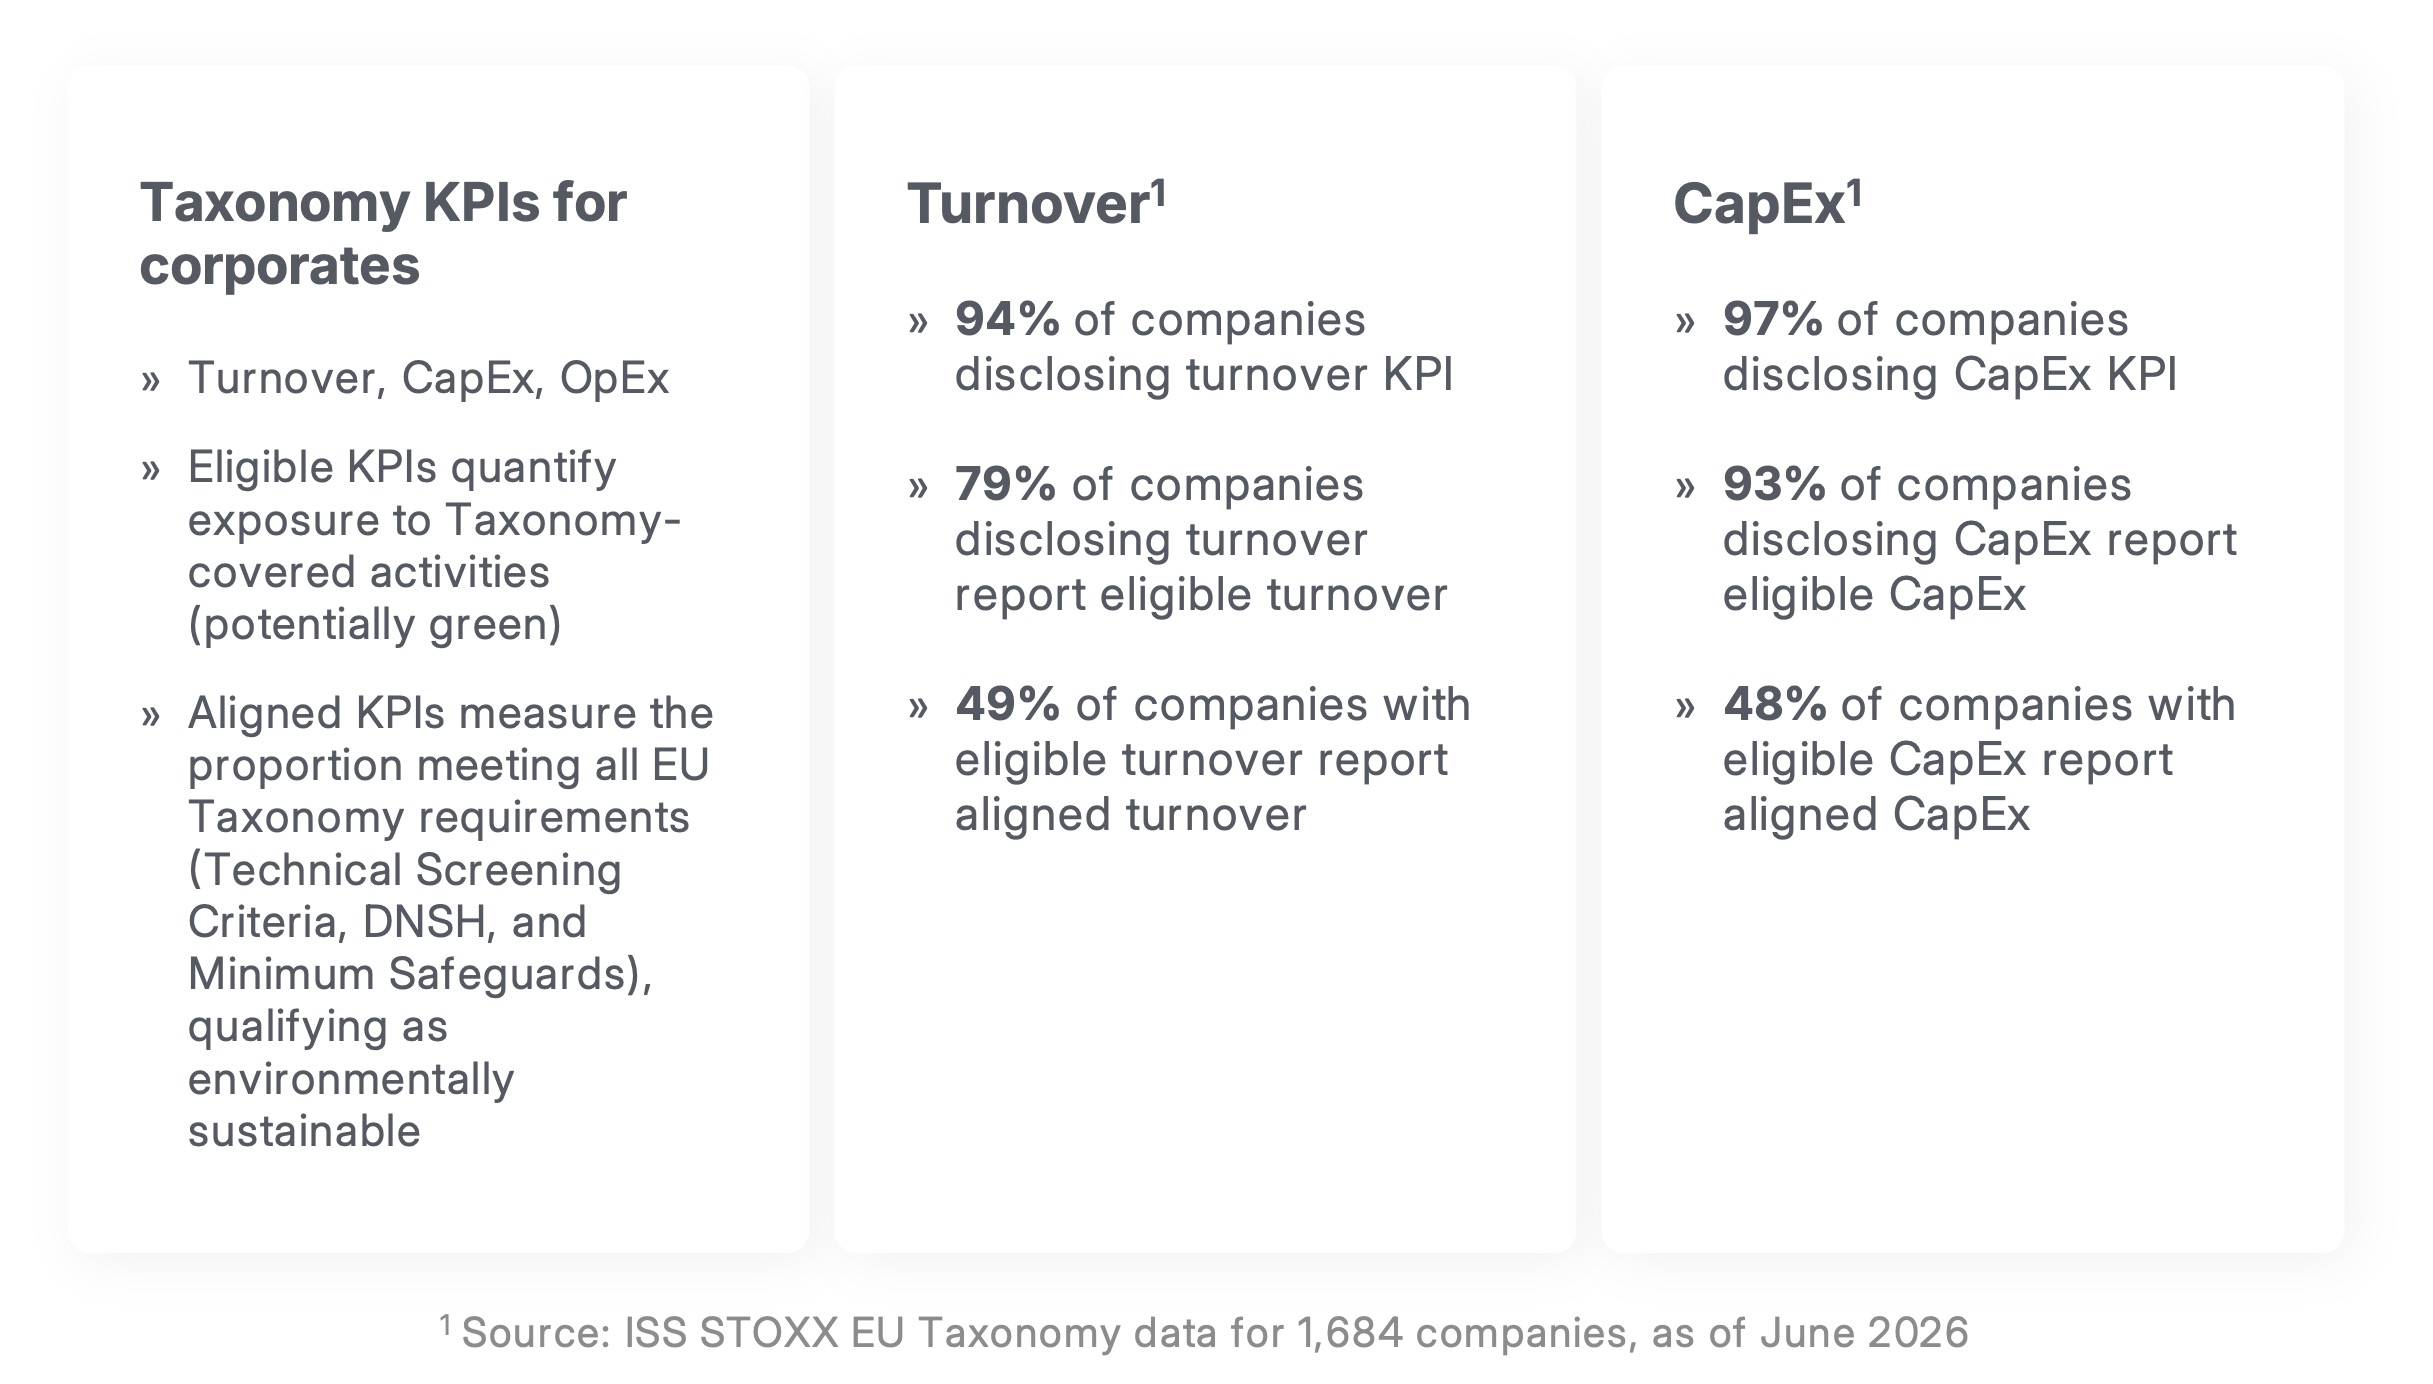
For corporates, the implications are significant. What began as a compliance requirement is increasingly being used to communicate sustainability performance, demonstrate alignment with transition pathways, inform capital allocation, and support investor engagement while reducing greenwashing risk. Our analysis of nearly 1,700 European non-financial issuers shows highly polarised outcomes. Disclosure rates are high, yet just over 50% of companies still report zero aligned turnover and zero aligned CapEx. At the same time, the share of eligible CapEx is generally higher than the share of eligible turnover, suggesting that companies often identify a broader pipeline of taxonomy-relevant investments.
What Companies Are Reporting Today: Practice and Progress
After several reporting cycles, a clearer picture is emerging. Most companies within scope now disclose taxonomy eligibility and, increasingly, alignment across turnover, CapEx, and OpEx. But maturity remains uneven. Large corporates are broadly engaged, yet eligibility often exceeds alignment. That gap reflects not only the complexity of the technical screening criteria and the challenge of assembling sufficiently granular, auditable data, but also the Taxonomy’s level of ambition: eligibility captures potential relevance, whereas alignment requires companies to show that an activity meets a deliberately demanding standard.
Our analysis confirms an uneven picture of taxonomy alignment. Alignment is concentrated among a relatively small group, while many companies remain at low or near-zero levels. This should not be read too simplistically as a proxy for weak sustainability performance. In many cases, it reflects structural constraints: some business models have limited eligible activities, while others struggle to evidence compliance with technical screening criteria, including Do No Significant Harm (DNSH) requirements, and minimum safeguards at the required level of granularity.
Company size adds another layer. Larger companies are materially more likely to report alignment than smaller peers. Among companies with eligible turnover, well over 60% of large- and mid-cap companies report aligned turnover, compared with 40% of small caps. The same pattern holds for CapEx. This pattern points to differences in reporting maturity, business model fit, and implementation capacity by size.
Sector dynamics are equally important. Where the Taxonomy aligns closely with business models, the picture looks very different. Utilities continue to stand out, with more than 90% of companies reporting aligned turnover and CapEx, followed by real estate, materials, and energy. By contrast, companies in consumer goods, pharmaceuticals, communications, and technology remain at much lower levels, underscoring that the Taxonomy’s relevance varies materially across sectors and transition pathways. This variation affects not only disclosure outcomes, but also how decision-useful Taxonomy metrics are for capital planning, transition signaling, and investor communication.
From Reporting to Magnitude: How Much is Aligned?
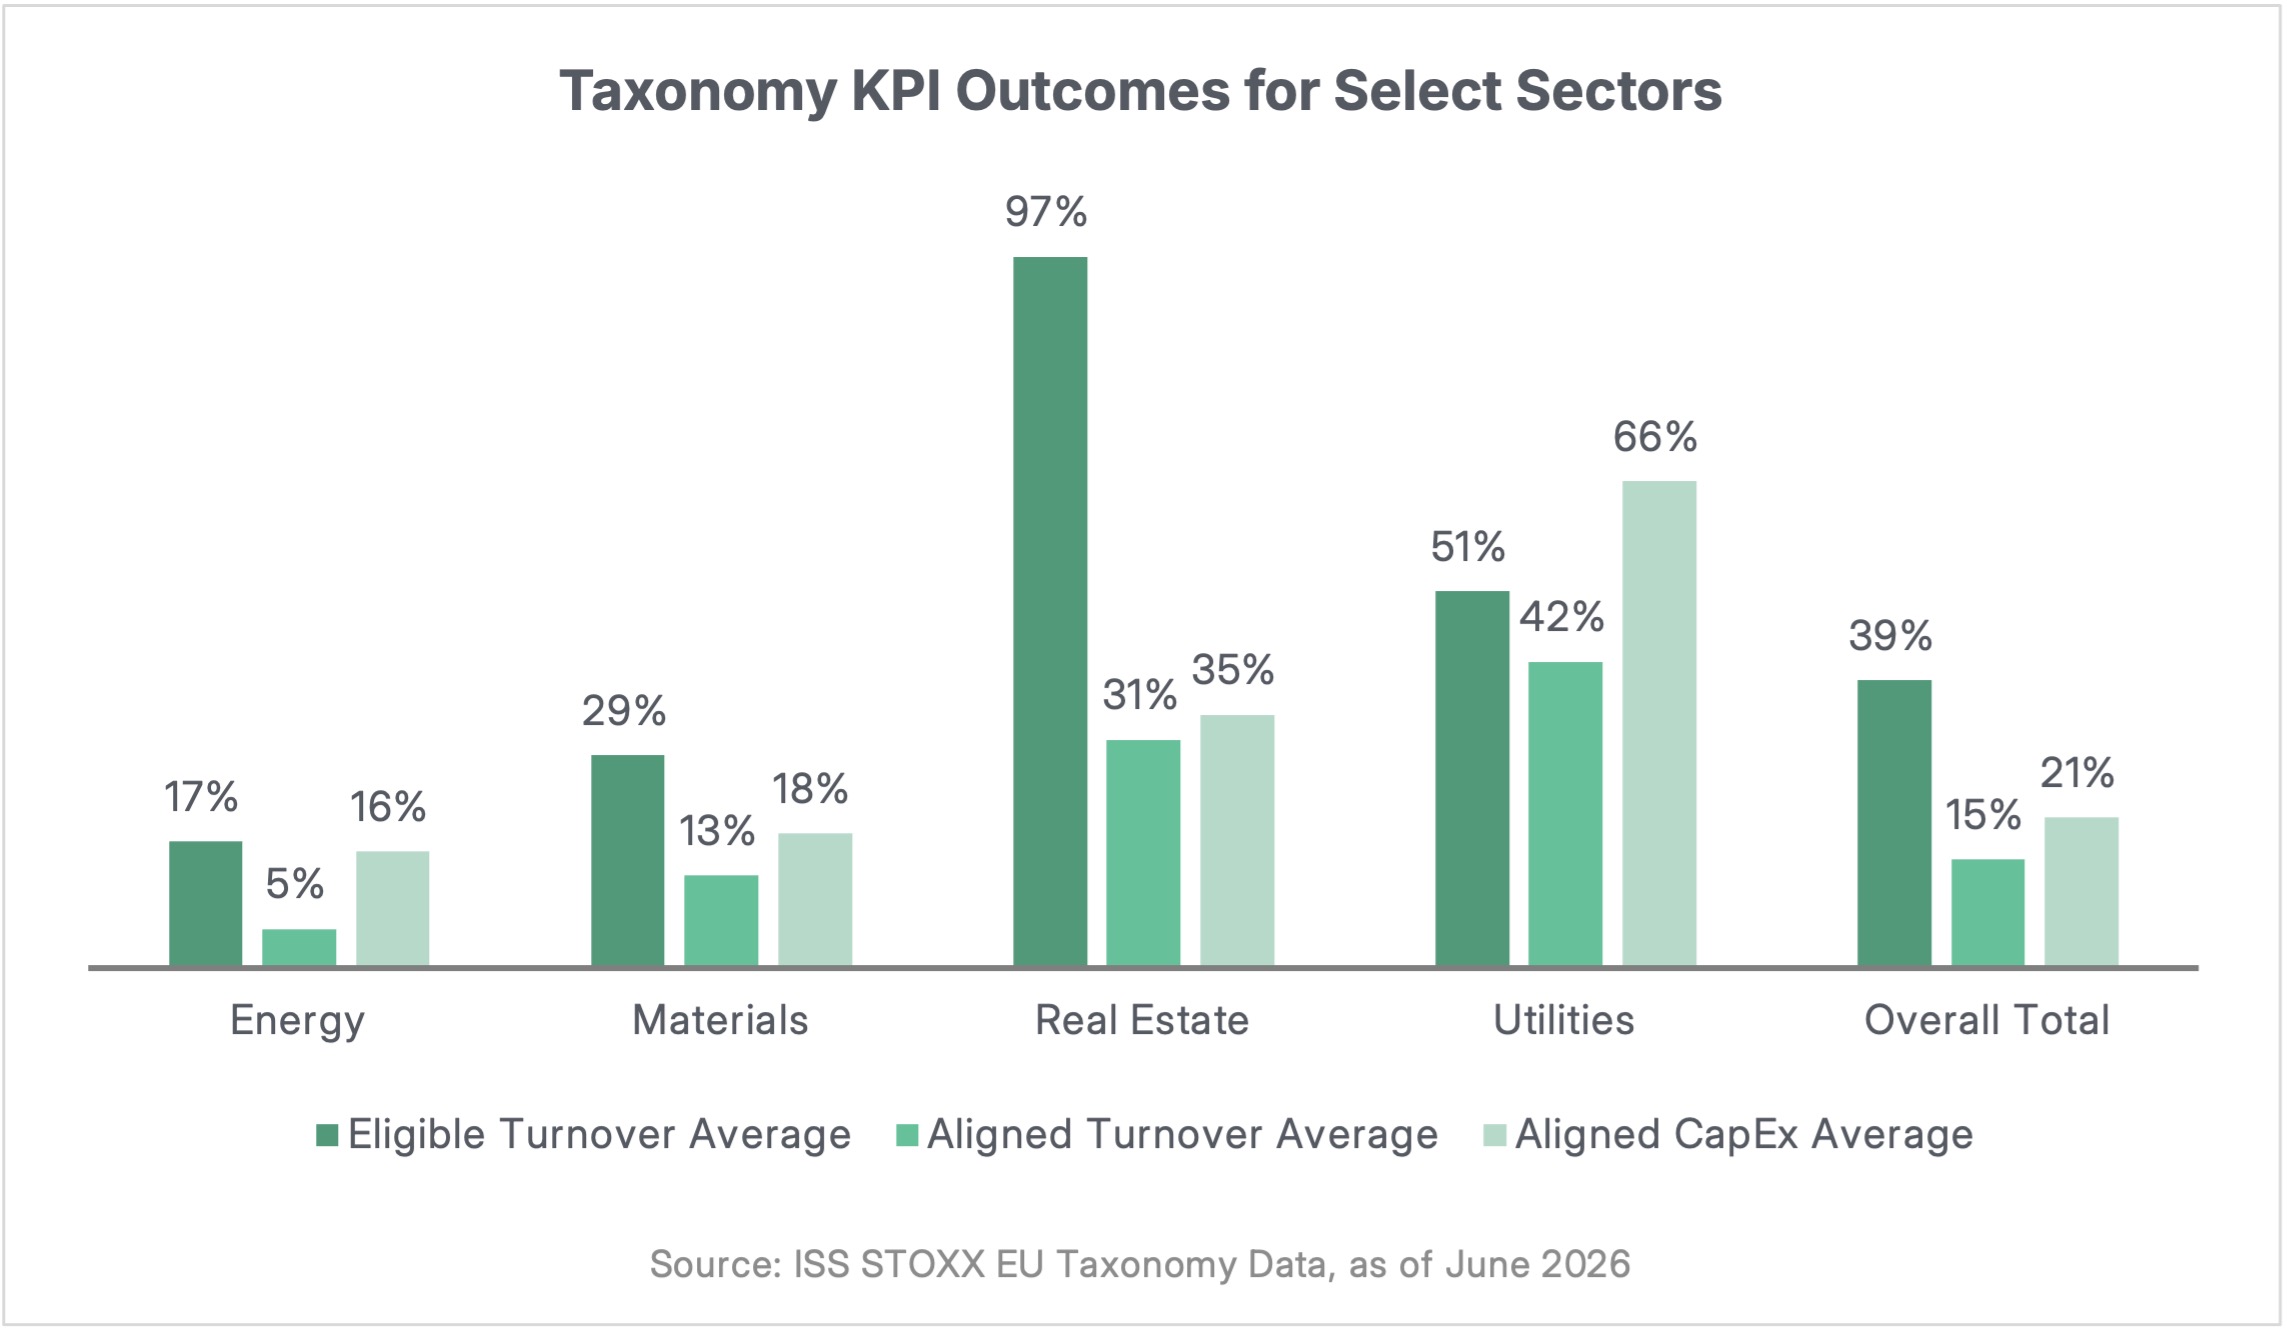
Beyond whether companies report eligible or aligned activity, an equally important consideration is the extent of eligible turnover, aligned turnover, and aligned CapEx. The graph below looks at the average level of eligible turnover, aligned turnover, and aligned CapEx across selected industries with the highest disclosure rates. This analysis provides a complementary view: not just whether Taxonomy outcomes are present, but how material they are on average.
The graph also highlights two important patterns: revenue alignment still lags eligibility, suggesting that many companies have relevant activities but have not yet met the full technical screening criteria, while aligned CapEx tends to outpace aligned turnover, indicating that investment is often progressing ahead of current green revenue generation.
Taken together, these findings highlight a central feature of the EU Taxonomy. Alignment is not evenly distributed across the economy, but reflects sector-specific applicability, implementation readiness, and transition pathways. Where the Taxonomy fits, it can serve as a meaningful measure of transition progress and a useful input into financing, investment, and strategic decision-making. Where it does not, zero alignment remains common and should be interpreted with care.
One of the most notable shifts is the growing use of Taxonomy data beyond reporting. As structured, comparable data becomes more widely available, companies are starting to use taxonomy metrics to inform capital allocation, track transition progress, and support investor communication. In the sectors where the framework is most relevant, the Taxonomy is becoming a more useful input into financing and strategy decisions.
In Conversation: Practical Insights on EU Taxonomy Implementation
To explore these developments in more detail, we spoke with Stian Køhn Berget, who works closely with corporates on EU Taxonomy implementation.
The EU Taxonomy can be difficult to navigate in practice, with technical legal text often referring to other technical legal text. How are companies managing this complexity?
A practical starting point is to focus on eligibility and build a clear understanding of the framework before going deep into technical detail. Companies that make progress tend to break the business down into reporting units that reflect how they already manage and report financially, whether by product line, business line, or asset base. Starting small helps. Rather than assessing everything at once, many organisations begin with one activity or reporting unit and build from there. That makes the process more manageable and clarifies what evidence and documentation will ultimately be required.
There is also a real difference between sectors. For businesses with clearly defined physical assets, such as renewable energy or utilities, it is often easier to translate the Taxonomy into operational terms. For others, including transport or more diversified business models, it can be harder to determine the right level at which to assess activities. Companies that move faster are usually those that establish an early structure linking activities, assets, and financial KPIs, rather than treating the exercise as a purely technical compliance task. That early structuring work often marks the difference between a one-off reporting exercise and a framework management that the company can use more strategically over time.
A consistent theme in market data is the gap between eligibility and alignment. In practice, where do companies struggle most when applying the technical screening criteria, particularly in relation to Do No Significant Harm (DNSH) criteria and minimum safeguards?
The most persistent challenges are documentation, interpretation, and asset-level evidence. Minimum safeguards are often more familiar to companies already working with frameworks such as the OECD Guidelines and the UN Guiding Principles. In the Nordics, for example, companies are often relatively well prepared because related concepts are already embedded in national regulation and due diligence practice. In Norway, the Transparency Act has created familiarity with the broader governance and due diligence principles that underpin minimum safeguards.
By contrast, the technical screening criteria, including substantial contribution criteria and DNSH requirements, can be far more demanding in practice. Physical climate risk assessments are a common gap, especially where companies have not yet carried them out at asset level or in line with the required scenarios and time horizons. Companies also face practical challenges in gathering supporting evidence across the organisation. For large real estate portfolios, for example, energy performance certificates may exist but be scattered across different teams or systems. Similarly, where an environmental impact assessment is required, the challenge is often to first determine whether the requirement applies and then to locate the relevant documentation. These are recurring implementation patterns: the information may exist, but it is often fragmented, inconsistently owned, or not yet organised in a way that supports robust Taxonomy reporting.
As we see from market data, CapEx alignment is often higher than revenue alignment. How are companies approaching the financial side of Taxonomy reporting in practice?
One of the main challenges is ensuring taxonomy reporting is structured consistently with financial reporting. For companies reporting under IFRS Accounting Standards, this is often easier because the turnover, CapEx, and OpEx KPIs are more closely linked to established financial definitions. For others using local GAAP frameworks, there can be more friction if taxonomy assessments are built on one logic while financial disclosures follow another. In those cases, companies often need to refine both their reporting structure and, over time, the way relevant data is tagged or mapped internally.
OpEx remains particularly challenging for many companies, and recent template amendments and simplifications have not removed all of that complexity. Even where materiality thresholds are available, companies still need to substantiate their conclusions and maintain a robust allocation logic. This underlines why finance teams need to be closely involved. Taxonomy reporting cannot sit only with sustainability or regulatory specialists; it increasingly requires coordination between sustainability, finance, and operations. More broadly, implementation challenges are shaped not only by company readiness, but also by continued regulatory refinement and evolving market interpretation.
Data remains one of the most frequently cited challenges. In your view, what does “good” look like in terms of taxonomy data management, and how are leading organisations structuring their data architecture to support both reporting and internal use cases?
Good taxonomy data management means moving beyond static spreadsheets towards a more structured, collaborative system. Many companies still start in Excel, but as assessments become more detailed and the regulation continues to evolve, manual approaches become harder to control. Errors can arise easily, criteria can be applied inconsistently, and even the distinction between eligibility and alignment can blur if data is not managed in a clear, auditable way.
Leading organisations increasingly recognise that taxonomy data needs to be maintained in a dynamic environment that supports version control, cross-functional collaboration, and robust documentation, particularly where multiple stakeholders contribute evidence or reporting logic evolves over time. More fundamentally, the Taxonomy can serve as a structured lens through which companies better understand their business activities, value chains, and operational dependencies. Used well, it is not only a reporting framework, but also a practical tool for identifying inefficiencies, improvement opportunities, and areas requiring stronger evidence or governance.
More broadly, the use case is expanding. Banks and investors are increasingly asking for taxonomy information, particularly in sectors such as real estate, renewable energy, and transportation. That growing demand, together with wider use of the EU Green Bond Standard, is increasing the strategic relevance of taxonomy data. For leading organisations, the direction of travel is clear: stronger taxonomy data architecture is becoming part of the infrastructure needed to support financing discussions, transition narratives, and more credible sustainability decision-making.
What EU Taxonomy Data Means for Reporting and Strategy
As EU Taxonomy reporting matures, the gap between eligibility and alignment is becoming more decision-relevant, not less. For companies, the focus is shifting from disclosure alone to how taxonomy data informs capital allocation, supports transition planning, and strengthens investor communication.
ISS-Corporate supports companies in translating EU Taxonomy requirements into structured, decision-useful reporting.
Discover how we can help you turn taxonomy data into more informed decision making »